Tallying the job losses: A quick view of private industry payroll employment

Job losses in private industry overall look grim (but unsurprising) when 2020 is compared to 2019.
The counts are in for payroll employment losses in the pandemic year 2020, and it isn’t pretty. The U.S. Bureau of Labor Statistics (BLS) has released its annual Census of Employment and Wages data for 2020. That data series lags other more current estimates, but its value lies in being the actual count of payroll jobs.
We look here at the losses in private industry overall, which look grim (but unsurprising) when 2020 is compared to 2019 job levels. We also look at manufacturing because of its importance to Indiana’s economy. It is also timely, as the federal government is accelerating efforts to re-shore critical manufacturing with its “100-day” assessment of critical manufacturing supply chains. (Note: Payroll job counts do not include the self-employed.)
These numbers reveal jobs lost between January and December of 2020, compared to the job levels in 2019, a year where many states were experiencing significant job increases among private industry sectors. The U.S. saw payroll job losses of 8.4 million, or 7% from its peak in 2019 of 126.4 million jobs (see Figure 1). Indiana also saw its peak in private employment in 2019, with 2.68 million jobs (see Figure 2).
Figure 1: U.S. private industry jobs
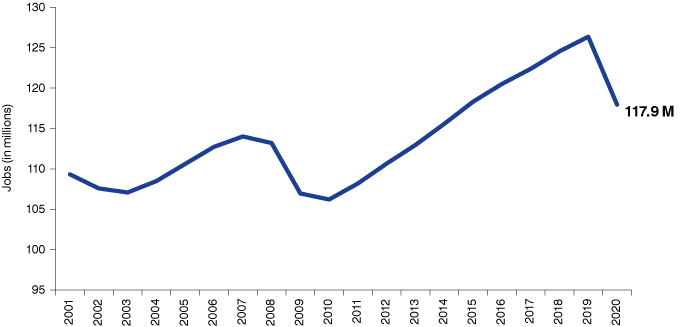
Source: STATS Indiana, using U.S. Bureau of Labor Statistics Census of Employment and Wages data
Figure 2: Indiana private industry jobs
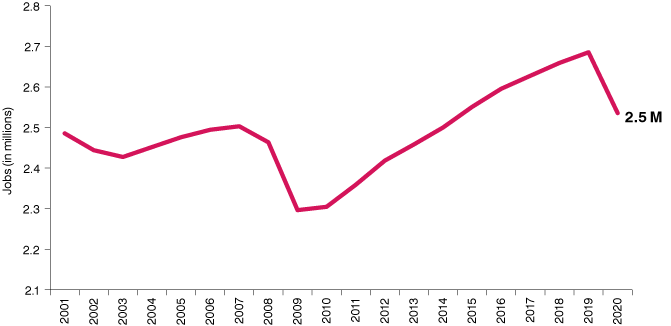
Source: STATS Indiana, using U.S. Bureau of Labor Statistics Census of Employment and Wages data
While Indiana’s manufacturing employment is still among the highest in the nation, the 2020 pandemic year took its toll there, too. The state was well on its way to reaching 550,000 jobs when the pandemic hit—dropping from 541,099 in 2019 to 504,494 in 2020.
Eleven states saw job losses exceed 8% of their total private industry jobs. Hawaii was hit the hardest with a 17.5% loss, and New York and Nevada each lost 11%. The maps below show the proportional losses by state for both private industry (Figure 3) and manufacturing (Figure 4).
Figure 3: Private industry jobs lost in 2020 (percent change from 2019 to 2020)
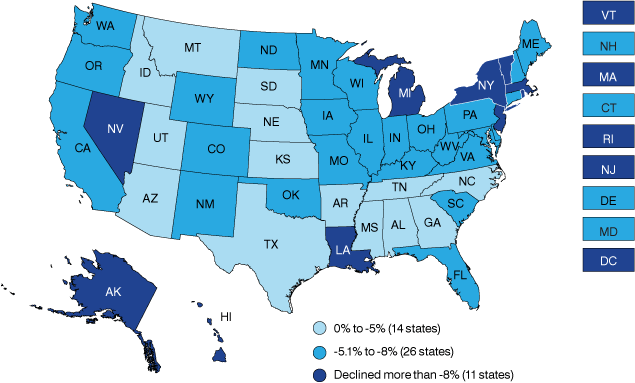
Source: STATS Indiana, using U.S. Bureau of Labor Statistics Census of Employment and Wages data
Figure 4: Manufacturing jobs lost in 2020 (percent change from 2019 to 2020)
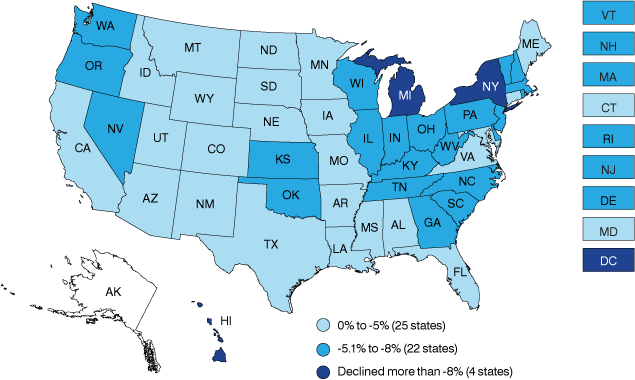
Note: Data for Alaska are undisclosable.
Source: STATS Indiana, using U.S. Bureau of Labor Statistics Census of Employment and Wages data
This was a quick overview of the employment counts, but you can find more detail on STATS Indiana with its annual CEW overview and time series data. Feel free to send questions and feedback too!
For more information on the federal supply chain review, the Information Technology & Innovation Foundation held a webinar on June 16 with federal officials and the Center for Strategic and International Studies provides a review by its experts.