Indiana's changing age mosaic

Only four Indiana counties saw growth in all six of the functional age groups.
Much has been written about baby boomers and the economic implications of the large increase in the elderly population as they age. But how have Indiana’s other age groups been changing? This article overviews changes in six age groups since 2010, based on the U.S. Census Bureau population estimates.
Figure 1 shows the functional age groups at the state level. Half (51 percent) of the Indiana population is between the ages of 25 and 64.
Figure 1: Indiana’s population by age
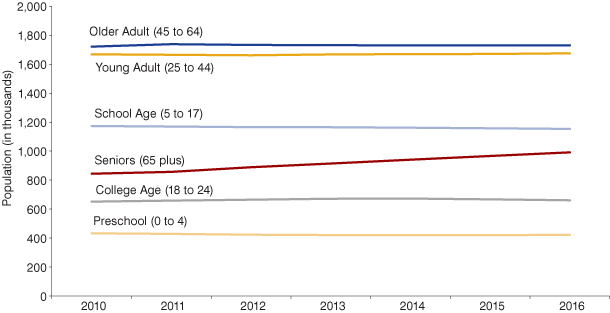
Source: IBRC, using U.S. Census Bureau population estimates
Thanks to the aging of the baby boom generation, the 65 and older crowd has grown by more than 147,000 since 2010 (see Figure 2).
Figure 2: Change in Indiana’s population by age group, 2010 to 2016
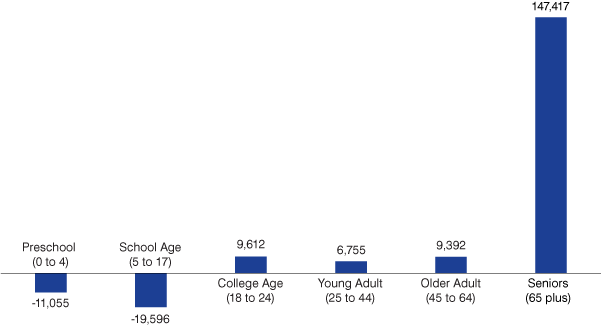
Source: IBRC, using U.S. Census Bureau population estimates
In percentage terms, the number of senior citizens increased 17.5 percent, while the number of preschoolers declined by 2.6 percent. For comparison, the number of senior citizens increased by nearly 22 percent nationwide.
Since Indiana’s total population grew less than the U.S. (2.2 percent vs. 4.5 percent) during the 2010-2016 time period, it is not surprising that the state lags the nation’s percent change for nearly every age group (see Figure 3).
Figure 3: Percent change in population by age group, 2010 to 2016
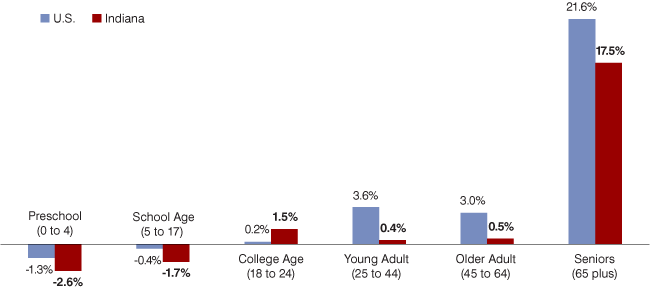
Source: IBRC, using U.S. Census Bureau population estimates
The college-age cohort is the one exception: Indiana’s 18- to 24-year-old population grew by 1.5 percent relative to the nation’s 0.2 percent growth. Since Indiana ranks third in the nation in terms of the net migration of college freshmen (according to National Center for Education Statistics data),1 one might assume that that plays a role in this growth; however, if you jump ahead to the county-level data in Figure 7, you’ll find that is not actually the case since several of the state’s college communities actually saw decreases in this age group.
Differences by county
Only four counties in the state (Boone, Clark, Johnson and Tippecanoe) experienced growth in all six age groups (see Figure 4). Meanwhile, 30 counties experienced declines in five of the six groups (no county experienced a decline in the number of senior citizens).
Figure 4: Number of age groups declining, 2010 to 2016
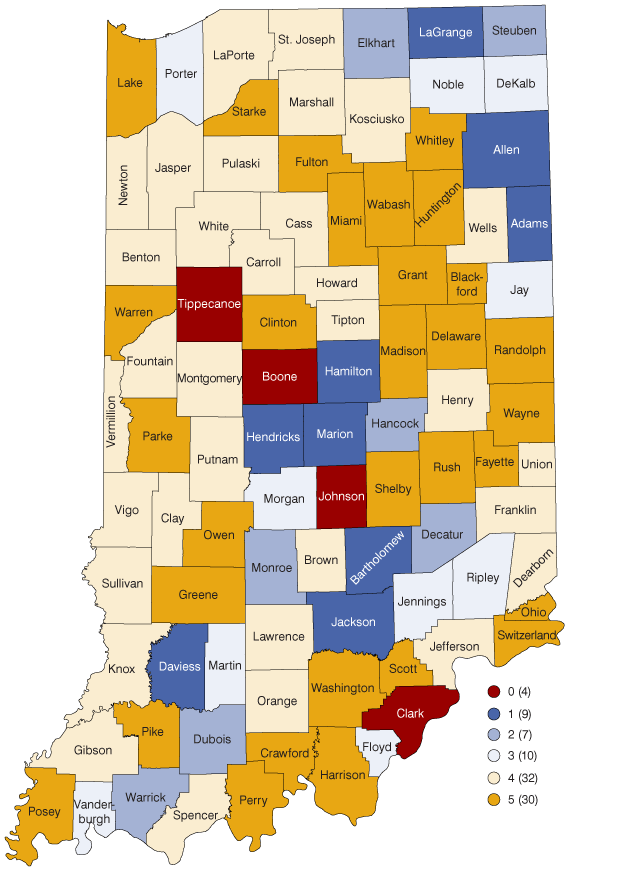
Source: IBRC, using U.S. Census Bureau population estimates
The following maps explore the population by age data at the county level.
Children
Only 17 counties experienced growth in the population under age 5 (see Figure 5). Marion, Tippecanoe and Boone counties each experienced gains of more than 500 children, while Boone (13.3 percent) and Jackson (9.7 percent) led the way in percent change.
Figure 5: Change in population under age 5, 2010 to 2016
Source: IBRC, using U.S. Census Bureau population estimates
At the other end of the spectrum, Lake County had nearly 3,000 fewer preschoolers than in 2010 and Madison County had a decline of 780. With a 23.2 percent decline, Brown County experienced the largest decline in preschoolers in percentage terms.
Most counties in the state also experienced declines in the population ages 5 to 17 (see Figure 6). Lake, Porter and LaPorte counties in northwest Indiana were three of the top four counties in terms of numeric losses. The largest gains were centered in central Indiana, with Marion and Hamilton counties each gaining more than 4,000 school-age children.
Figure 6: Change in school-age population, 2010 to 2016
Source: IBRC, using U.S. Census Bureau population estimates
In percentage terms, Union County (-19.9 percent) experienced the largest decline, while Tippecanoe County had the biggest gain in the 5-to-17 age group (11.9 percent).
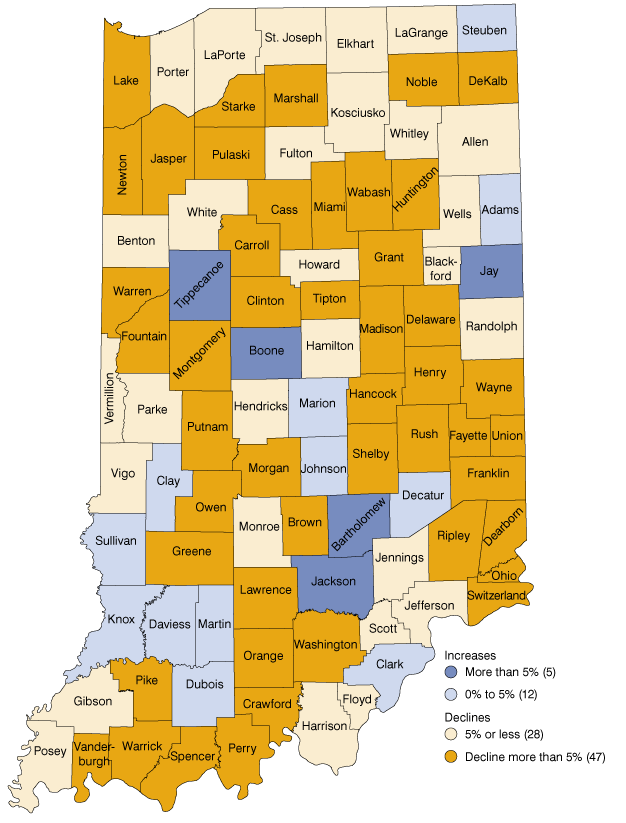
Adults
Figure 7 illustrates the change in population for the 18-to-24 age group. With a nearly 7,700 increase, Hamilton County saw a whopping 47.8 percent gain in its college-age population. Differences in the underlying age structure (e.g., more 17 year olds aging into the group or fewer 25 year olds aging out of it) don’t explain much of this change. It could be that the spike in Hamilton County’s apartment construction is making the county more attractive to young college graduates.2
Figure 7: Change in college-age population, 2010 to 2016
Source: IBRC, using U.S. Census Bureau population estimates
Neighboring Marion County had the largest decline in this age group (-4,919), while tiny Ohio County had the biggest percentage drop in college-age residents (-19.5 percent).
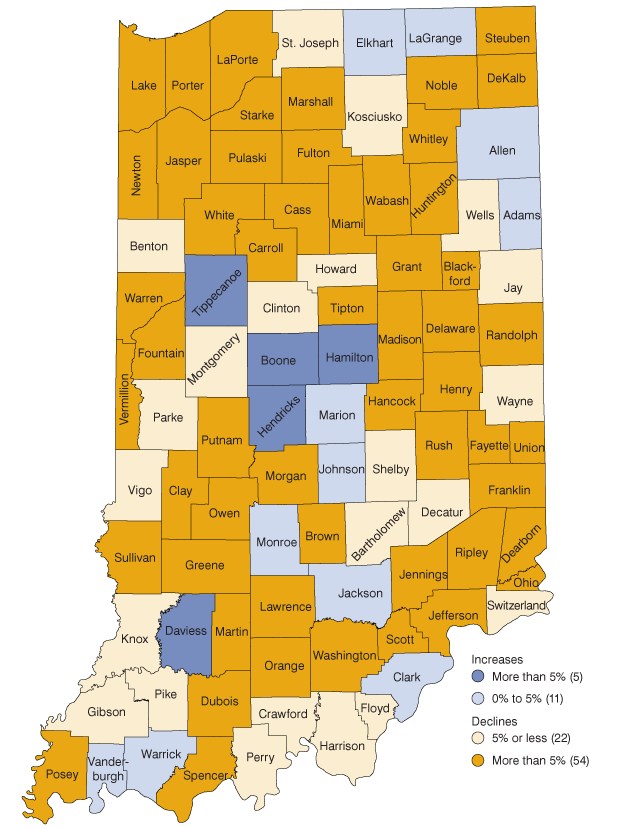
Figure 8 shows that only 18 counties saw gains in the population between the ages of 25 and 44. Marion (+13,301) and Allen counties (+3,537) top the list numerically, while Boone and Bartholomew counties saw the largest percentage increases (14.4 percent and 8.7 percent, respectively).
Figure 8: Change in young adult population, 2010 to 2016
Source: IBRC, using U.S. Census Bureau population estimates
At the other end of the spectrum, Union, Tipton and Warren counties each experienced losses of more than 11 percent. With nearly 5,000 fewer young adults, Lake County had the largest numeric decline, followed by Madison County with a decline of 1,284.
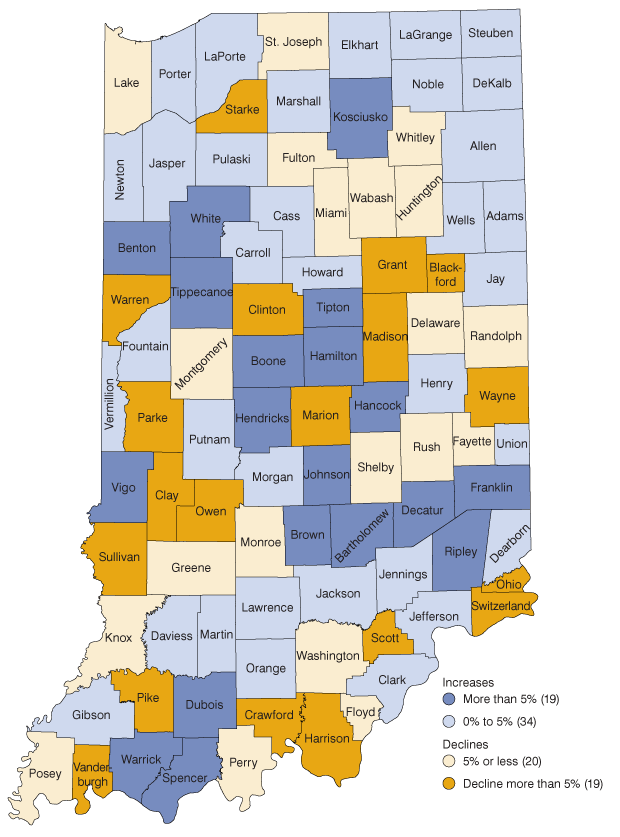
Twenty-five counties saw increases in the 45-to-64 age group (see Figure 9). Hamilton County led the growth in both numeric and percentage terms, with a gain of 12,442 (17.6 percent). Meanwhile, Blackford and Brown counties each had declines of 9.3 percent in the older adult population. Lake County, once again, had the largest decline numerically (-3,777), followed by LaPorte County (-1,311).
Figure 9: Change in older adult population, 2010 to 2016
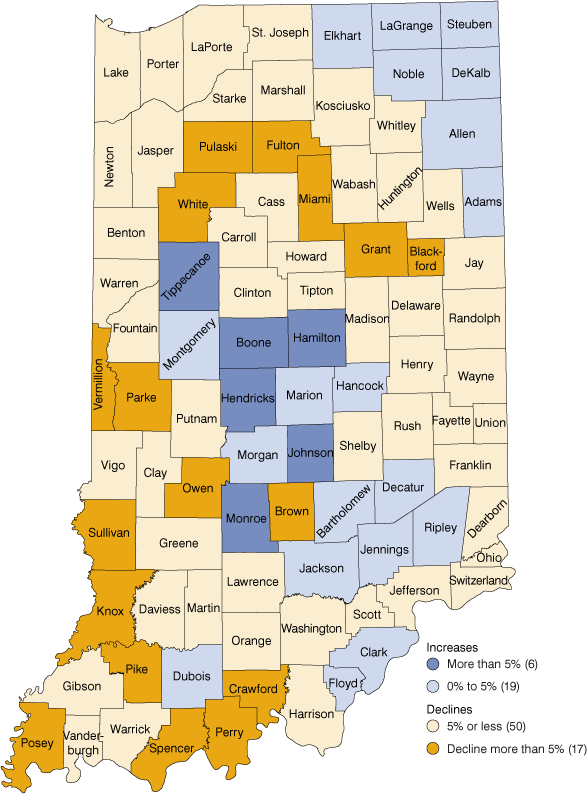
Source: IBRC, using U.S. Census Bureau population estimates
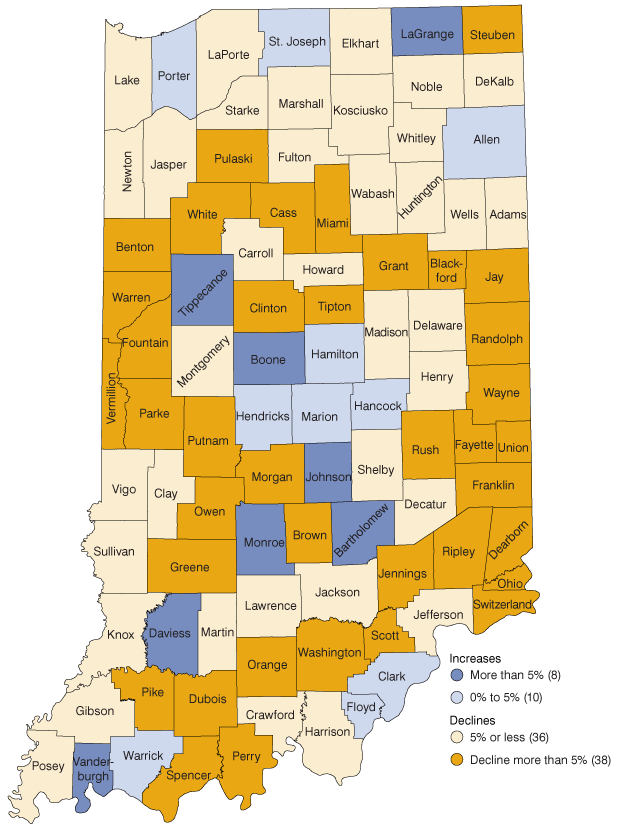
The astute reader may have noticed that the preceding maps all use the same legend breaks to aid in comparison between the maps. That does not work when it comes to the 65 and older population because only Benton County saw an increase below 5 percent. In fact, 10 counties saw increases in this age group exceeding 25 percent (see Figure 10).
Figure 10: Change in population age 65 and older, 2010 to 2016
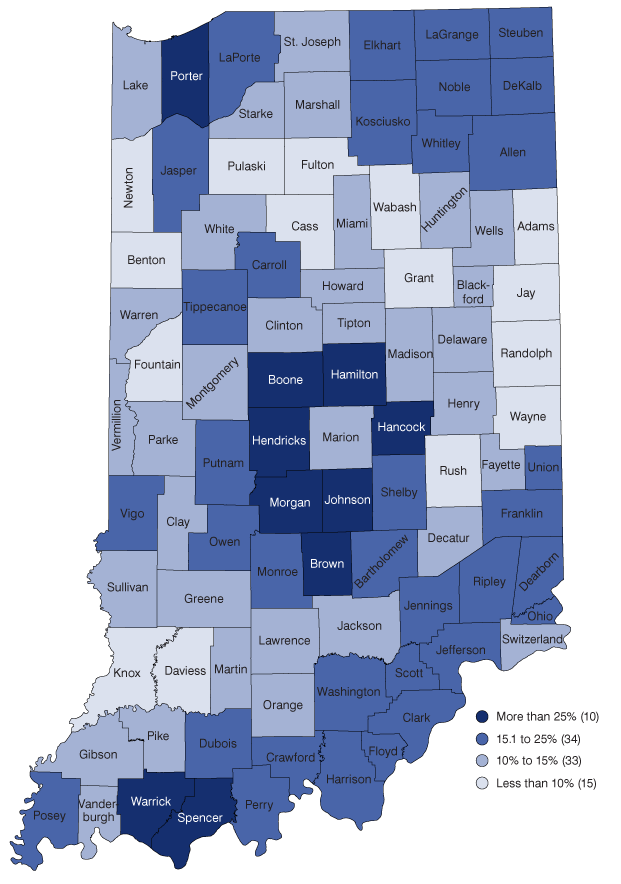
Source: IBRC, using U.S. Census Bureau population estimates
Summary
Between 2010 and 2016, one out of three Indiana counties lost population in every age group except for the 65 and older group. Given that another third of the state’s counties lost population in four of the six age groups, many Indiana communities may have cause for concern as the baby boomers increasingly age out of the workforce.
From an economic perspective, the shifts in the young adult (ages 25 to 44) and older adult (ages 45 to 64) populations are key because those are prime working years. While both of those age groups grew between 2010 and 2016 at the state level, the gains were relatively small and were not evenly distributed. In fact, 62 of the state’s 92 counties experienced declines in both of those age groups during that time period.
Anticipating the future shifts in these critical age groups is important for economic development and planning. The Indiana Business Research Center will soon be releasing an update of the state’s official county-level population projections on STATS Indiana, so local communities can explore how their demographics are likely to change in the coming decades.
Notes
- View state rankings for college enrollment and migration at USA States in Profile at www.stats.indiana.edu/sip/Education.aspx?page=all&ct=S18.
- Multi-family building permits in Hamilton County averaged 499 permits per year between 2010 and 2012, jumping to an average of 1,789 per year between 2013 and 2015.