Put these in your workforce and economic development toolkit

Workforce and economic data are available by using tools from the Hoosiers by the Numbers website.
What are the occupations held by the largest number of workers in Terre Haute? Office and administrative support workers; production workers; and food prep and serving are the three largest occupation groups in the metro area. Which are the highest paid occupations in Terre Haute? Management, engineering and health care occupations top that list.
How do we know this? The Indiana Department of Workforce Development, as part of a federal survey, conducts the annual Occupational Employment Statistics (OES) survey each year, which includes approximately 7,000 employers in Indiana. The results are made available on their Hoosiers by the Numbers website, either using an interactive selection tool or by viewing the new infographic/dashboard. Figure 1 shows images from that new tool, which allows users to view and select any of Indiana's metropolitan areas.
Figure 1: Terre Haute occupation data
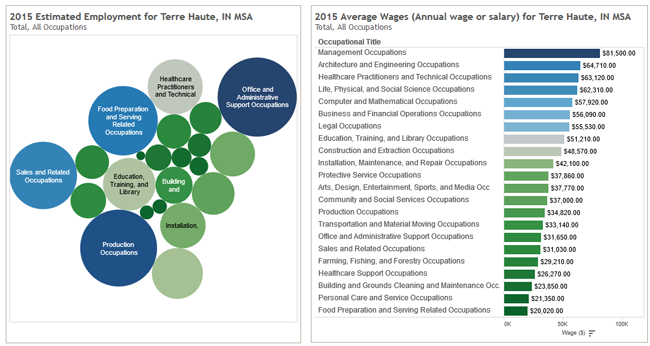
Source: Indiana Department of Workforce Development, using Occupational Employment Statistics data
Why just metro areas (and the “balance” of those areas not in a metro)? The survey is small enough that there wouldn’t be sufficient data for each county. But then again, we are a state of commuters—most workers drive at least 20 minutes to work and often work in one county while living in another.
Speaking of commuting, be sure to check out the commuting patterns tools available. One shows annual commuting, or work-residence patterns, based on crunching data from the IT-40 (state income tax) forms each year. You can check out every county in the state and also download high-resolution images to put on your own websites or in presentations, reports or articles (see Figure 2).
Figure 2: Commuting into Vigo County, 2014
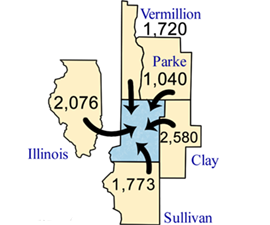
Source: STATS Indiana, using Indiana Department of Revenue data
The second is the relatively new (released in 2016) regional commuting tool, which is based on American Community Survey data from the U.S. Census Bureau. With this tool, you can select any of a number of regions from the drop-down menu, or “clear” the map and click on whichever counties you want to show. Figure 3 looks at Vigo and two other Indiana counties (Sullivan and Vermillion), as well as two Illinois counties (Clark and Edgar), so we can see the extent of cross-state commuting—a very powerful way to understand where Hoosiers go to work. The results show that this five-county cross-state region has a labor market of nearly 76,000—and 88 percent of the residents with jobs both live and work within these five counties.
Figure 3: Cross-state regional commuting
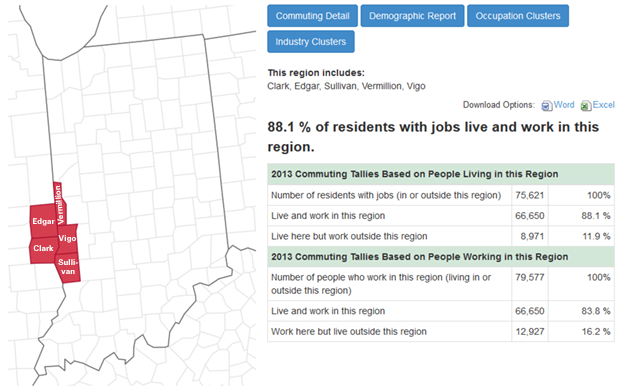
Source: Hoosiers by the Numbers, using U.S. Census Bureau American Community Survey data
More tools and data are available on Hoosiers by the Numbers (www.hoosierdata.in.gov), and here are some quick links for bookmarking: