GDP Dynamics Shed Light on Economic Downturn in Indiana
There has been no shortage of information detailing the current economic downturn. Monthly reports on job losses and growing unemployment have chronicled the recession’s impact on the labor force both nationally and locally. Quarterly releases of gross domestic product (GDP) and personal income have offered broader indicators of economic performance and well-being for the United States. However, recent releases of regional GDP data by the U.S. Bureau of Economic Analysis offer our first look at the economic performance of states and metropolitan areas through 2008.1
GDP, which is widely regarded as the most comprehensive indicator of economic activity, measures the total value of goods and services produced within an area after subtracting the cost of inputs for production. Recently released data indicate that Indiana was among the most hard-hit states through the initial stages of the recession, particularly in Elkhart-Goshen and Kokomo. However, declines in economic activity were not seen throughout the state. GDP growth in the Columbus, Bloomington and Lafayette metropolitan areas was comparable to their average rates of growth in the years preceding this downturn.
Change in GDP for States
Indiana’s GDP (adjusted for inflation) declined 0.6 percent between 2007 and 2008. This mark ranked 43rd among states and, as Figure 1 shows, made Indiana one of 12 states to have a decline in real GDP in 2008. Alaska, Delaware, Florida and Michigan had the steepest drops with each state declining by more than 1 percent over the year. North Dakota, Wyoming, South Dakota and the District of Columbia posted the strongest growth in real GDP in 2008 while the United States grew by just 0.7 percent.
Figure 1: Percent Change in Real GDP, 2007-2008
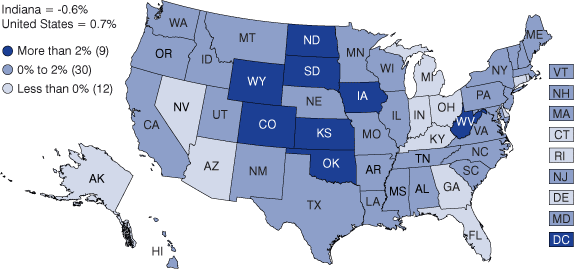
Source: IBRC, using data from the Bureau of Economic Analysis
While many states experienced real GDP growth in 2008, all but nine grew at a slower pace than in prior years. The United States 2008 growth rate of 0.7 percent, for instance, falls far short of its 2.5 percent average annual rate of real GDP growth from 2001 to 2007. Figure 2 presents this rate comparison for the 12 states with GDP declines in 2008. Real GDP in Indiana grew at an average annual rate of 1.7 percent between 2001 and 2007, ranking 40th among states. Neighboring Michigan and Ohio recorded the nation’s slowest rates of economic growth from 2001 to 2007 and remained among the poorest performers in 2008.
Figure 2: Recent Activity for States with Real GDP Decline in 2008
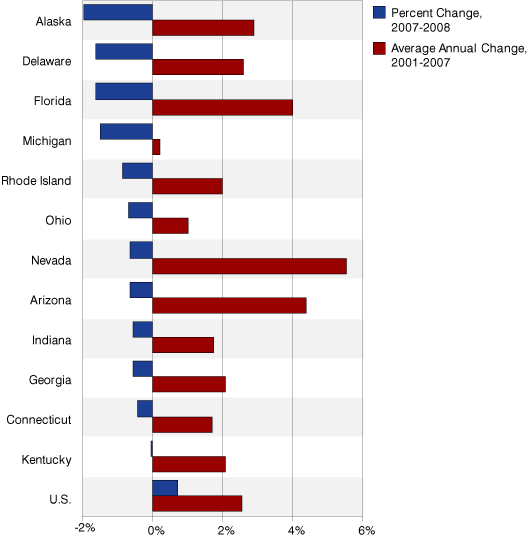
Source: IBRC, using data from the Bureau of Economic Analysis
Notable shifts among this 12-state set include Nevada and Arizona, which had ranked first and third, respectively, in the average annual rate of real GDP change between 2001 and 2007. Florida, Alaska and Delaware also had average rates of change over this period that exceeded the national average.
The sharp turnabout in GDP change for Nevada, Arizona and Florida is directly related to the weakened housing market that has headlined this economic downturn. Construction was the largest contributor to real GDP decline in each of these states. As Figure 3 illustrates, construction was the largest negative contributor to real GDP change in 16 states as well as for the United States as a whole. Many of these states are located in the high population growth areas of the South and the West. Other common industries in decline in 2008 were nondurable goods manufacturing and finance and insurance.
Figure 3: Industry with the Largest Negative Contribution to Real GDP in Each State, 2008
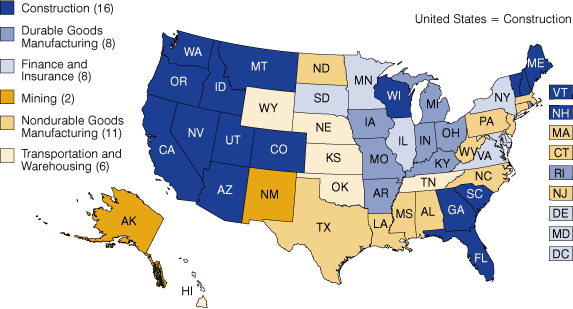
Note: Three states had ties, so the industry with the larger share of GDP is shown on the map. The tied industries not shown include: Washington (nondurable goods manufacturing), Virginia (construction) and Oklahoma (agriculture).
Source: IBRC, using data from the Bureau of Economic Analysis
Figure 4 highlights the industries that had the greatest influence, positive and negative, on Indiana’s 2008 change in real GDP. Each industry’s impact is expressed as its percentage point contribution to Indiana’s total percent change in real GDP.
Figure 4: Industries with the Largest Positive and Negative Contributions to Indiana's Real GDP Change, 2008
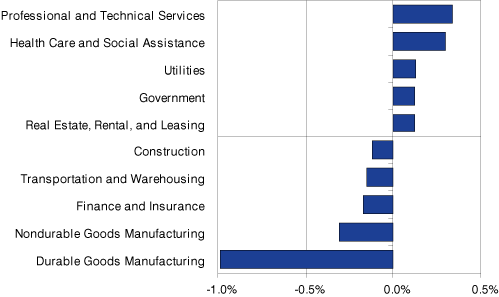
Source: IBRC, using data from the Bureau of Economic Analysis
Durable and nondurable goods manufacturing were the largest contributors to decline. The drop in manufacturing also weakened Indiana’s transportation and warehousing industry. The other industries with large negative impacts on GDP change—construction and finance and insurance—were influenced, at least partly, by turmoil in the housing market. Growth in the professional and technical services industry as well as in health care and social assistance provided the largest positive contributions to Indiana’s GDP change.
GDP Change in Indiana’s Metropolitan Areas
Nine of the 13 metropolitan areas (MSAs) centered in Indiana had a negative real GDP change in 2008 (see Figure 5). The sharpest drops occurred in the Elkhart-Goshen and Kokomo MSAs, which fell by 10 percent and 9 percent, respectively. Elkhart-Goshen and Kokomo have the unfortunate distinction of recording the two largest declines in real GDP among the nation’s 366 MSAs in 2008. Their declines are even more dramatic when considering that Elkhart-Goshen ranked 25th nationally in the average annual rate of real GDP growth from 2001 to 2007 and Kokomo ranked 80th.
Figure 5: Change in Real GDP for Indiana MSAs, 2001-2008
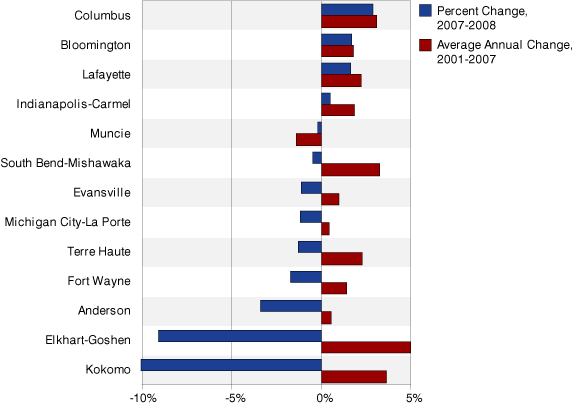
Source: IBRC, using data from the Bureau of Economic Analysis
Much of the situation in Elkhart-Goshen and Kokomo (and Indiana in general) can be attributed to the dominant role that manufacturing plays in these economies. In 2007, no state had larger share of its total GDP in manufacturing than Indiana and no metropolitan areas in the state were more dependent on manufacturing than were Kokomo and Elkhart-Goshen (see Figure 6). More than half of all economic activity in these MSAs was in manufacturing. Of course, much of the manufacturing in these communities has been focused on automotive parts and recreational vehicles—industries that have been particularly hard-hit in this downturn.
Figure 6: Manufacturing's Share of Total GDP in Indiana MSAs
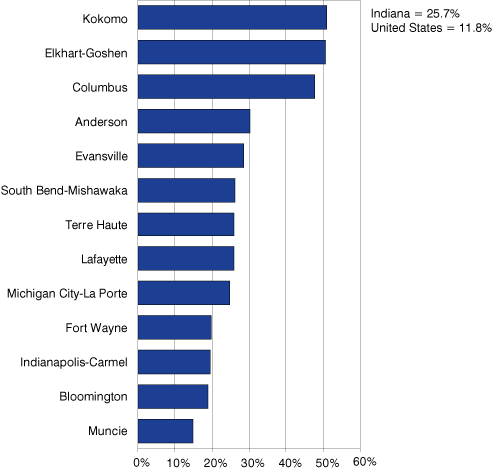
Source: IBRC, using 2007 data from the Bureau of Economic Analysis
It is interesting to note that Columbus had nearly half of its economic activity in manufacturing in 2007, but 2008 real GDP growth in Columbus barely missed a beat compared to its average rate in the preceding years. Columbus has not gone completely unscathed, however. Durable goods manufacturing, the area’s key industry, grew by 3.5 percent in 2008—well below the 8.6 percent average growth rate for 2002 to 2007. This deceleration was partially offset by above average GDP growth in service-providing industries. Bloomington, Lafayette and Indianapolis-Carmel were the other Indiana MSAs that recorded positive real GDP change in 2008.
Muncie, which has had a negative rate of real GDP change throughout this decade, was the only Indiana MSA whose 2008 mark was an improvement over its average rate between 2001 and 2007. Muncie experienced continued decline in manufacturing output but was buoyed by stronger than normal GDP growth in service-providing industries such as professional and business services and, surprisingly, financial activities.
Readers may also be interested in the economic performance of MSAs centered in bordering states that include Indiana counties. 2008 real growth in the Cincinnati-Middletown MSA was essentially flat at 0.1 percent. Chicago-Naperville-Joliet (-0.4 percent) and Louisville-Jefferson County (-1.3 percent) each had negative real GDP change. At 0.5 percent growth, Indianapolis-Carmel outperformed its nearby big city peers in 2008.
Conclusion
Difficulties in the housing market have weakened the construction and finance industries in many states—Indiana included. Like much of the Midwest, however, Indiana has been most heavily impacted by softened demand for manufactured products, particularly in the automotive and recreational vehicles industries. Nowhere has this been more keenly felt than in the Elkhart-Goshen and Kokomo metropolitan areas. The effects of the recession continue to be felt and the numbers for 2009 will likely show further declines.
As we begin to emerge from this economic downturn, however, states such as Indiana may be better positioned to return to accustomed levels of economic activity. That is, a rebound in consumer demand should rekindle economic growth in Indiana and other manufacturing-focused states. The same may not be true in areas where robust GDP growth prior to the recession was driven by unsustainable real estate development. Granted, Indiana’s rate of economic growth throughout this decade has left something to be desired. The key to improving Indiana’s economic performance moving forward will be to maintain Indiana’s position as a national leader in manufacturing while expanding opportunities in other high-growth production or service industries.
Notes
- The Bureau of Economic Analysis accelerated the production of 2008 GDP data for states and metropolitan areas. These data are presented a year earlier than similar figures have been available in the past. These figures should be considered preliminary and will be revised with the release of 2009 GDP data for states and metropolitan areas.
Matt Kinghorn
Demographer, Indiana Business Research Center, Indiana University's Kelley School of Business