Hoosier Businesses Ramp Up Exports
Vincent Thompson
Economic Analyst, Indiana Business Research Center,
Kelley School of Business, Indiana University
Indiana firms continue to compete globally, and international trade is playing a significant role in Indiana’s ongoing economic recovery. In light of the latest export figures, perhaps Indiana’s reliance on manufacturing is not as problematic as some had recently thought.
The data in this article are from the Census Bureau’s Origin of Movement (OM) state export series (1) based on transportation origin (exports of services are excluded). These figures do not directly represent the production origin of the merchandise.
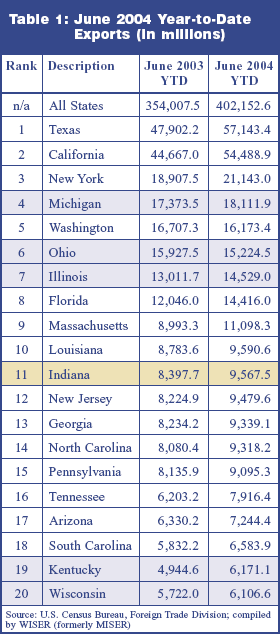
Nationally, the value of Indiana’s exports ($16.4 billion) ranked 12th in 2003 (see Figure 1), up from 13th in 2002 and 15th in 2001. Hoosier businesses continue to ramp up exports, as Indiana moved up to 11th place according to June 2004 year-to-date exports (2) (see Table 1).
We surpassed New Jersey and North Carolina, which were ranked 11th and 12th,
respectively, based on April 2004 year-to-date figures.
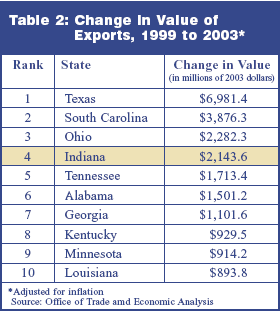
Indiana’s strong advances in exports are more evident if we look at
the change in exports between 1999 and 2003 (see Table 2). In order to account
for inflation, the 1999 figures were adjusted to 2003 dollars before calculating
these differences. Indiana is ranked fourth in the nation by this longer-term
measure.
What Are We Exporting?
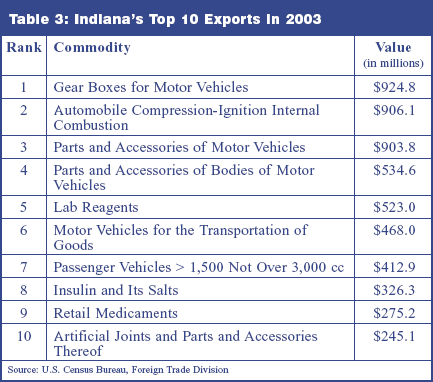
Six of Indiana’s top 10 exports are related to automobile manufacturing and four to the life sciences sector (see Table 3). These 10 exports account for about $5.5 billion, or approximately one-third of the value of all exports transported from Indiana in 2003.
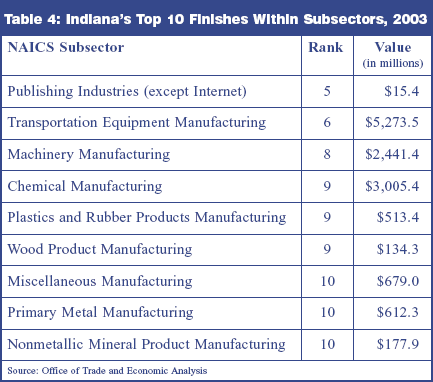
If we look at performance by NAICS industry, it is notable that Indiana has placed in the top 10 within nine subsectors (see Table 4). Our best finish was fifth place for exports from the publishing industries (except Internet), valued at about $15.4 million. The next best finish was sixth place for exports of transportation equipment. That subsector has the distinction of having the highest export value of all subsectors at nearly $5.3 billion, or just less than one-third of the value of Indiana’s exports. Other strong finishes include eighth place for machinery manufacturing, and ninth place for chemical, wood product, and plastics and rubber product manufacturing.

Where Do Our Exports Go?
Canada is Indiana’s number one trading partner, followed by Mexico (see Figure 2). Canada is by far the dominant importer of Indiana’s goods, its volume exceeding Mexico’s by almost $5.4 billion. In addition, 11 of the top 25 importing countries are European and 10 are Asian. Brazil and Australia account for the remaining two countries. These 25 countries imported about $15.6 billion, or 95 percent of Indiana’s 2003 exports.
Click for larger image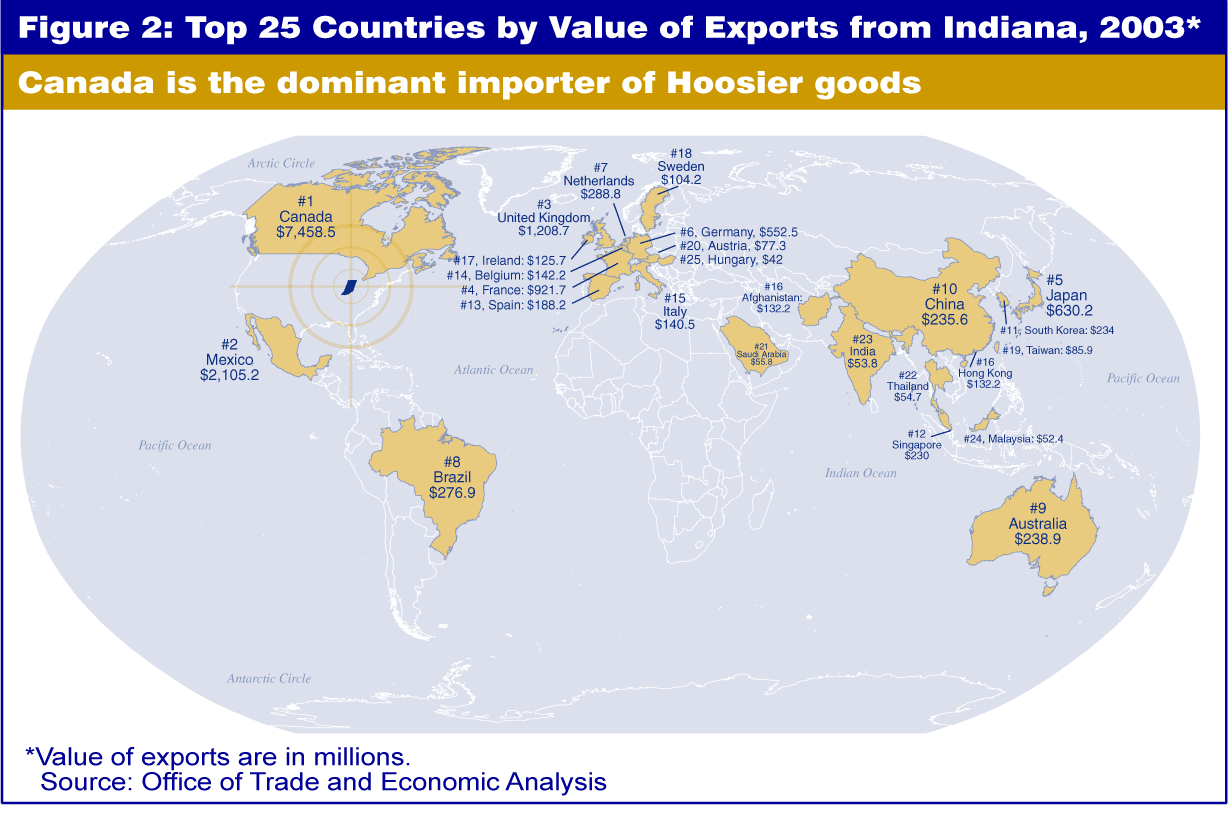
Neighboring States
Like Indiana, our neighboring states (with the exception of Kentucky) show an emphasis on the automobile manufacturing industry in their top three exports. Kentucky’s major strong point is the aircraft manufacturing industry; however, it does show some emphasis on automobile manufacturing based on its top 25 exports (see Table 5). (3)
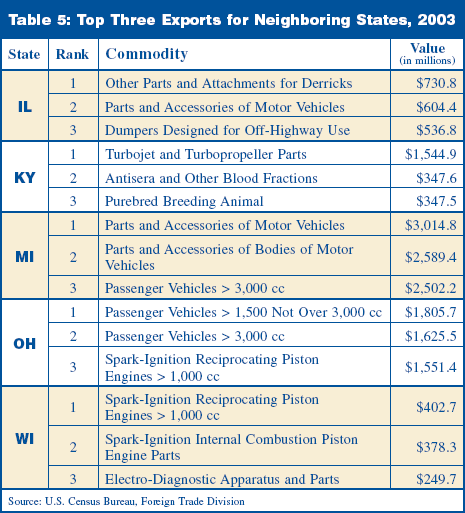
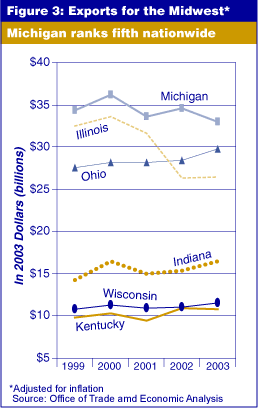
Figure 3 shows Indiana’s overall performance in exports compared to neighboring states from 1999 to 2003. The values were adjusted to 2003 dollars for comparability. Michigan takes the lead throughout this period, while Illinois’ exports have not yet returned to pre-2002 levels. Nonetheless, all six Midwestern states are competing well globally, with Michigan ranking fifth nationally in 2003, Ohio sixth, Illinois seventh, Indiana 12th, Wisconsin 19th and Kentucky 22nd.
Notes
- See the International Trade Administration website for descriptions: www.trade.gov/mas/ian/otii/index.asp.
- June 2004 year-to-date export figures were provided by the World Institute for Strategic Economic Research (WISER). WISER is a new organization formed to continue the work of the Massachusetts Institute for Social and Economic Research (MISER), which closed its doors on June 30, 2004. WISER can be found on the Web at www.wisertrade.org.
- More detail is available on the Census Bureau website: www.census.gov/foreign-trade/statistics/state/index.html.