Where Did Hoosiers Live in 1995?
In 2000, 90.7 percent of Indiana's citizens age five and older had also lived in the Hoosier state in 1995. This finding from Census 2000 suggests very little in-migration to the state during the last five years of the 20th century.
Before we look at the numbers in detail, remember that the Census question looked at two points in time. It is common to treat these data as if we were dealing with continuous residence. But we are not. The data fail to consider that Hoosiers may have been out of state in other years. For example, we do not know if someone left Indiana in 1996 and returned in 1999 after four years of college or military service. In that respect, this statistic can understate in-migration and the return of former residents.
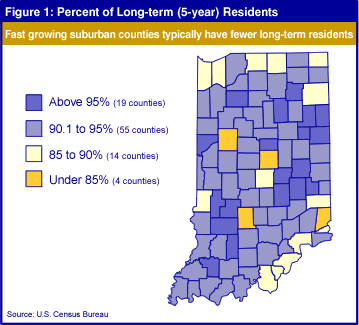
Accepting this possible misinterpretation, Rush, Blackford and Martin led the 71 Indiana counties that exceeded the state figure for having "long-term" (i.e. five-year) residents. At the other end of the distribution, attracting residents from outside Indiana were Monroe and Tippecanoe counties with fewer than 82 percent of their citizens in residence for five years. Fast growing suburban counties of Hamilton and Dearborn also had fewer than 85 percent of these "long-term" residents (see Figure 1).
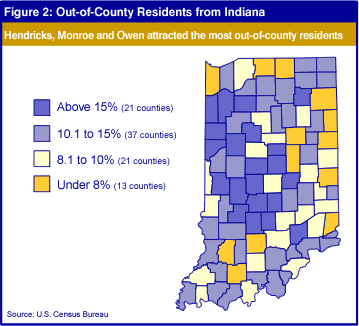
Which counties are attracting residents from other parts of Indiana? Figure 2 shows that Hendricks, Monroe and Owen are the leaders, more than double the state figure of 10.2 percent. Trailing the list in attracting other Hoosiers are Lake, Wayne, Dearborn, St. Joseph and Allen counties.
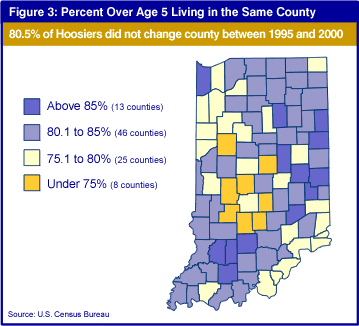
The picture changes when we look at the counties that had high (and low) percentages of persons age five and older living in the same county in both 1995 and 2000. Statewide, 80.5 percent of Hoosiers did not change county, with Adams, Daviess and Dubois leading the list-all above 88 percent. A careful examination of Figure 3 will show that most of the counties below 78.1 percent were suburban or developing ex-urban counties.
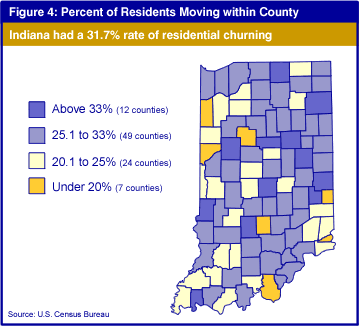
People can live in the same county as five years earlier, but nonetheless move within the county. We can call this "residential churning" and it was found to be greatest in Marion County where 42.1 percent of the "long-term" residents changed houses in the five years between 1995 and 2000. The lowest rate of such "residential churning" was in Warren, Brown, Newton, and Ohio counties (see Figure 4). Statewide, Indiana had a 31.7 percent rate of "residential churning."
These data give us some insight into the dynamics of the housing markets in our different counties. They may provide us with more understanding of the political stability of some counties as well as of the attractiveness of opportunities available in different parts of the state